 Zhcloudlink
Home / Solutions / AI Smart Scenic Site Solution
Solutions
AI Smart Scenic Site Solution
The Zhcloudlink AI smart scenic site solution uses smart cameras and edge computing for crowd counting, crowding alerts, fall and risky-behavior recognition, litter and smoke-and-fire detection, and visitor-path analysis. Existing surveillance can be connected.
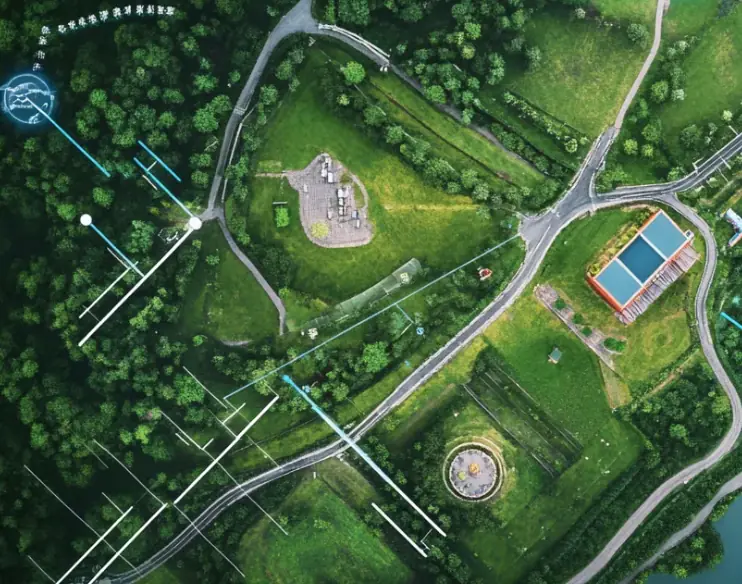
SOLUTIONS / Smart Scenic Site
Zhcloudlink (Shenzhen) Technology Co., Ltd. uses smart cameras and AI algorithms to put crowd flow, risky behavior, and the scenic environment in one system. Edge nodes analyze first in real time, and the cloud then aggregates the results, which makes duty watch and dispatch easier.
Overview
Core technology
Based on AI computer vision, smart cameras and algorithms provide all-around monitoring and management, raise safety management, improve the visitor experience, and lower operating cost.
Application scenes
Coverage includes visitor safety management, scenic environment management, visitor-service optimization, and further uses such as wildlife, historic buildings, parking, and queues.
Goals and value
Duty staff see crowding, falls, climbing, and smoke and fire earlier. Cleaning and security work from the alerts. The site adjusts services from crowd flow and visitor paths.
System architecture
01 Front-end layer
HD cameras, smart IPCs, and face-capture cameras collect data. They can be used with AI cameras.
02 Edge layer
Edge computing nodes analyze video in real time and shorten alert delay. Video analytics can use edge boxes such as AIBox03 and AIBox05.
03 Cloud platform
It aggregates data, stores it, analyzes it in depth, and visualizes it. Compute servers, the scenic operations cockpit, the smart scenic platform, and the ticketing system exchange inference results over HTTP, MQTT, REST API, and callbacks.
Visitor safety management
Crowd flow, crowding, and falls
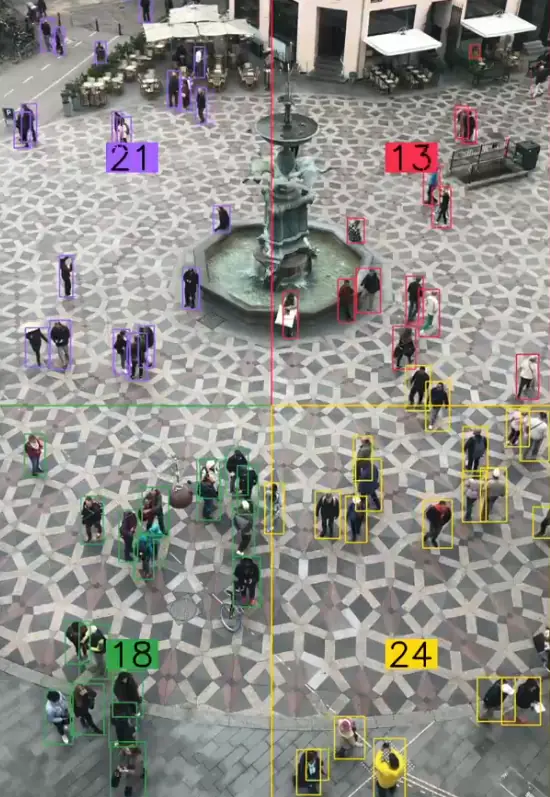
Object detection, multi-object tracking, and crowd-density analysis count visitors in each zone and avoid overcrowding. A warning is issued when density rises or an abnormal gathering appears, which lowers stampede risk.
Pose estimation finds a visitor who has fallen, so older visitors can be helped in time. Face capture at entrances and major attractions is used for visitor counts, VIP recognition, and blacklist alerts.
Risky behavior and missing-person alerts
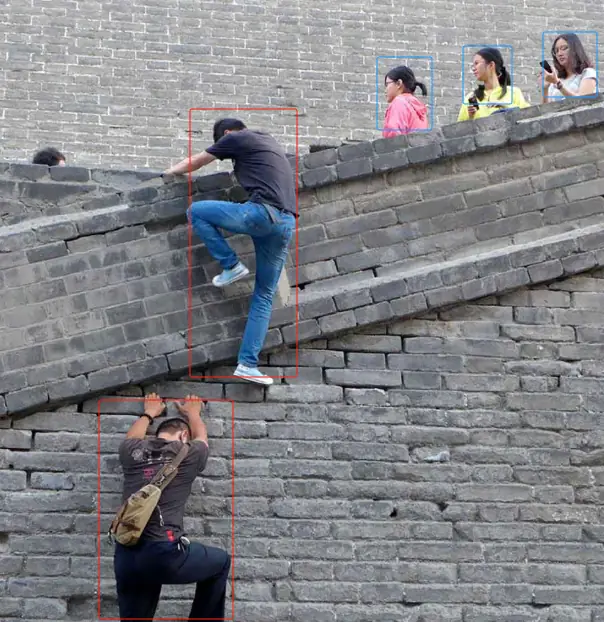
The system recognizes climbing a wall, crossing a railing, and approaching a dangerous area. Area-intrusion detection keeps visitors out of restricted zones.
A warning is raised when a child moves alone and is too far from a guardian, which reduces the chance of a child going missing. Abnormal behavior such as fighting or running fast is pushed to staff.
Scenic environment management

Litter and overflow
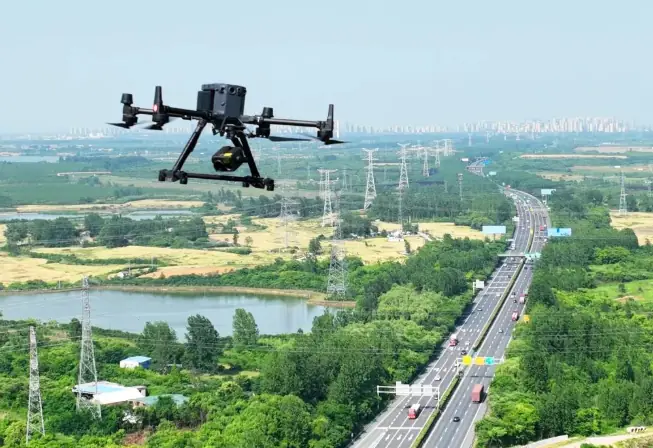
Detect litter on the ground and full bins, so collection routes can be planned.
Smoke, fire, and water
Smoke and flame are used for early fire warning. Dangerous water is watched for visitors who enter against the rules.
Vegetation and facilities
Check vegetation for withering, pests, and similar problems, and check damage to facilities such as seats and railings.
Visitor services and further uses
Dwell time, paths, and queues
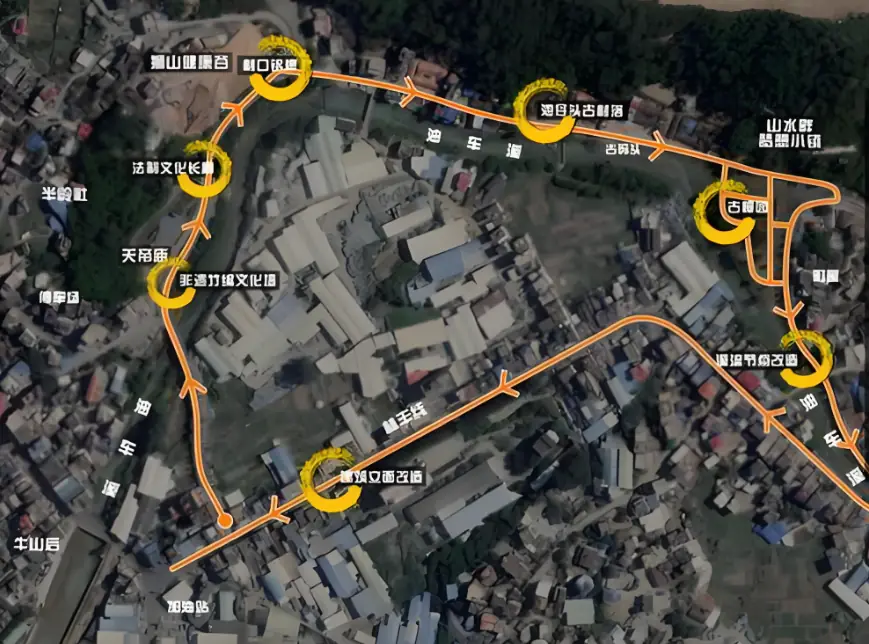
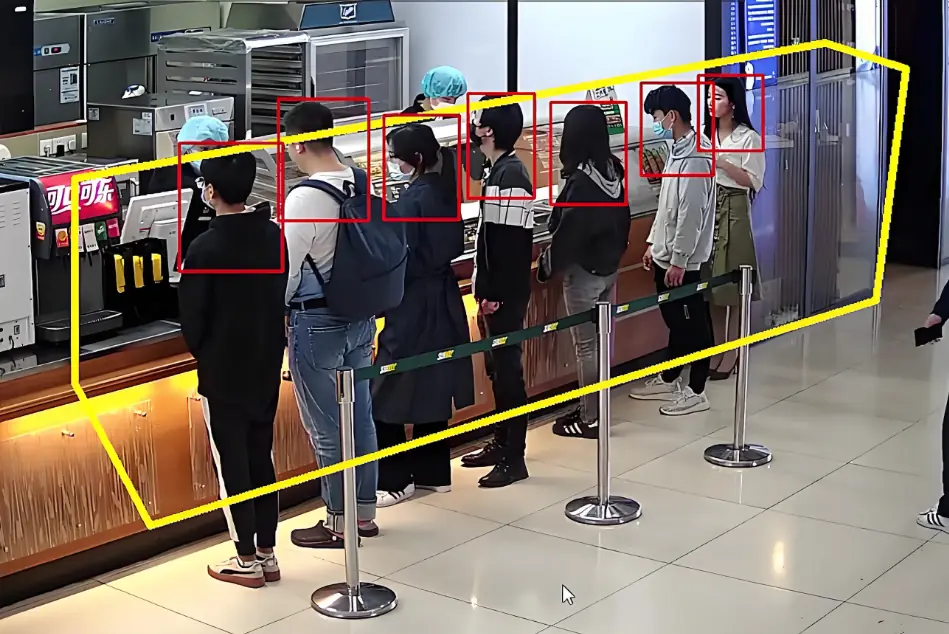
Dwell time is counted at each attraction. Tracks and heat show touring routes, which makes it easier to adjust guidance. Queue zones count people and waiting time.
Visitor-attribute analysis counts profiles such as age and gender. Expression recognition is used to assess satisfaction. Unattended retail recognizes goods, which makes self-checkout easier.
Protection and parking
- Wildlife monitoring: recognize animal activity inside a protected area.
- Historic-building protection: detect behavior that touches or damages relics.
- Parking-space management: see which spaces are occupied, so vehicles can be directed.
- AR guidance: an extended capability for visitor services.
Rollout plan and expected benefits
System advantages
- Edge computing handles processing in real time and shortens alert response.
- Deep-learning recognition. The solution states accuracy above 95%.
- Modular design, so functions can be extended for the site.
- Existing cameras can be reused. Current surveillance can be connected, and several camera types are supported.
Rollout schedule
- Requirements survey: 1–2 weeks.
- Solution design: 2–3 weeks.
- Equipment installation and deployment: 4–8 weeks, depending on area and complexity.
- System commissioning: 1–2 weeks. Training and handover: about 1 week.
Expected benefits
- Safety-incident rate reduced by more than 60%.
- Visitor satisfaction raised by more than 30%.
- Operations-management efficiency raised by more than 50%.
- Cleaning and security labor cost reduced by 40%, and additional spending encouraged.
Questions
What problems does the smart scenic site solution mainly address?
It uses AI vision for scenic-site monitoring and management, covering visitor safety, environmental sanitation, visitor services, and extended scenes such as parking and cultural relics. The aim is to see risk earlier, reduce manual patrols, and tune services to the crowd flow.
How many layers does the system have?
The front-end layer captures video, the edge layer analyzes it in real time, and the cloud platform aggregates, stores, analyzes in depth, and visualizes the results. The platform can connect to the scenic operations cockpit, the smart scenic platform, and the ticketing system. Interfaces include HTTP, MQTT, REST API, and result callbacks.
What recognition does visitor safety include?
Crowd counting, face capture and matching, crowding alerts, fall detection, climbing and restricted-zone intrusion, missing-child alerts, and abnormal behavior such as fighting and running.
What can environmental management detect?
Litter on the ground, overflowing bins, smoke and flame, intrusion into dangerous water, abnormal vegetation, and damage to facilities such as seats and railings.
Can existing cameras stay in use?
Yes. Existing surveillance can be reused, and several camera types are supported. New points can use AI cameras. Analytics compute sits on an edge box or on a compute server in the scenic-site equipment room.
How long does it take from survey to delivery?
Survey 1–2 weeks, design 2–3 weeks, installation and deployment 4–8 weeks, commissioning 1–2 weeks, and training about 1 week. Site area and the number of points change the deployment time.